


Financial and Operational Results
| Unit | 2020 | 2021 | 2022 | 2023 | 2024 | |
|---|---|---|---|---|---|---|
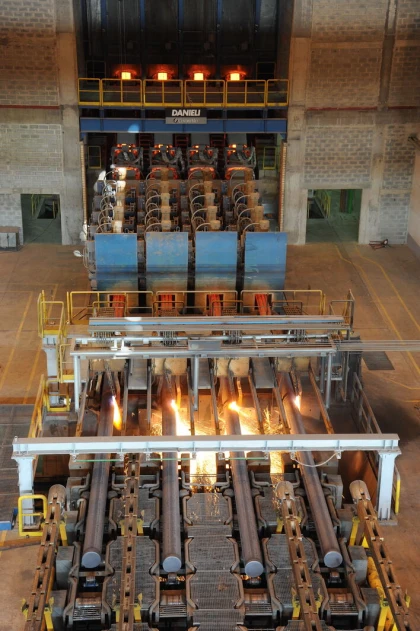
| Steel production | thousand tons | 758 | 972 | 595 | 680 | 834 |
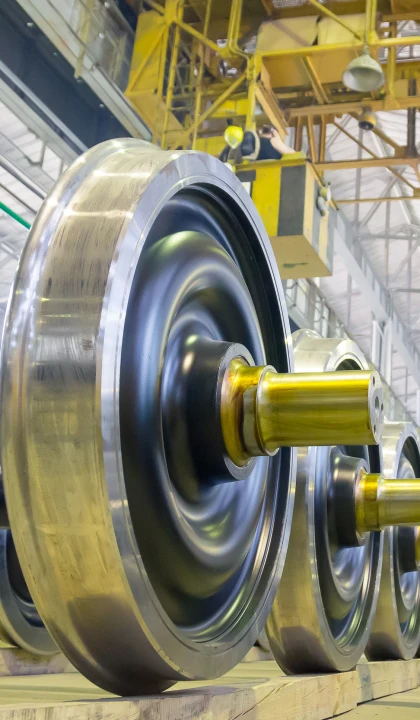
| Railway product production | thousand tons | 190 | 172 | 84 | 100 | 112 |
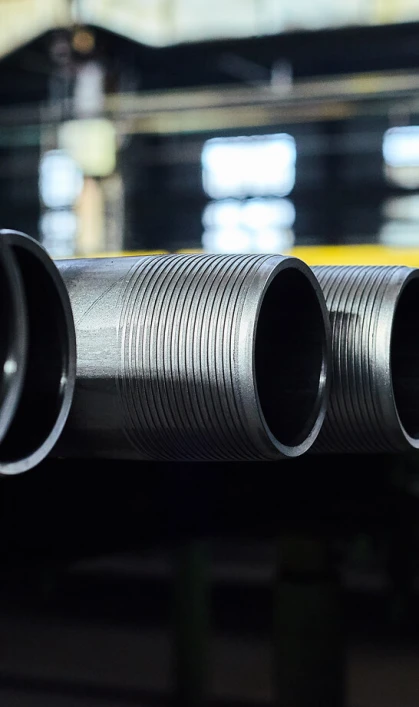
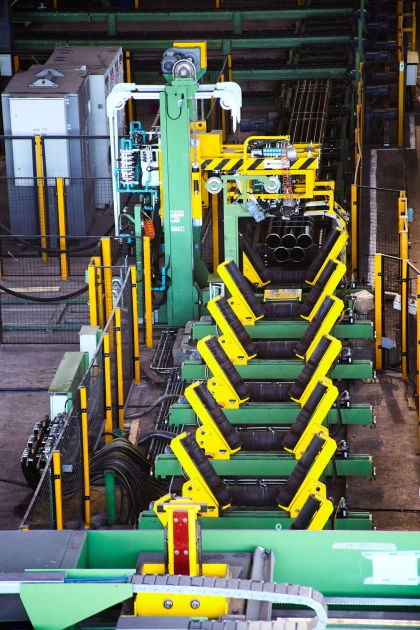
| Pipe production | thousand tons | 464 | 615 | 393 | 395 | 507 |
| Revenue | million US dollars | 865 | 1,133 | 981 | 989 | 1,050 |
| EBITDA* | million US dollars | 273 | 228 | 204 | 337 | 284 |
| EBITDA margin | % | 32% | 20% | 21% | 34% | 27% |
| Capex** | million US dollars | 44 | 63 | 21 | 31 | 40 |
| Free cash flow*** | million US dollars | 121 | -2 | 142 | 147 | 113 |